Profile Image

Hello, Myself

SATYA VENKATA SIDDHARTHA BOKKA

And I'm a

Geomatics Engineer in Calland Engineering|Ex-Intern at KMC | MS Student in GIS at SUNY Buffalo | Member of NYS GIS Association | Specializing in Spatial Data Science, Water Systems, Environment & Spatial Modelling and Urban Development Projects

View CV

About Me

Driven by a Master's in Geographic Information Systems and a Bachelor's in Geo-Informatics, I bring a strong foundation in geospatial analysis, data management (including MySQL), and real-life problem solving. My work experience spans academic roles, municipal utility projects, and renewable energy planning with deep involvement in GIS and remote sensing technologies.A GIS professional with strong foundations in geospatial analysis, remote sensing, and machine learning. Experienced with ArcGIS Pro, QGIS, ENVI, Python, and R to analyze spatial patterns. Skilled in database systems including ArcGIS Enterprise and MySQL for urban infrastructure mapping.Passionate about leveraging spatial insights to inform smart city planning and disaster response. Adept at delivering data-driven geospatial solutions through modern tools and interdisciplinary research.

Professional Experience

Geomatics Engineer – Calland Engineering Inc. (Aug 2025 – Ongoing)

Work under technical direction from Professional Land Suveyor and Civil Engineers to integrate survey, CAD, and geospatial data systems, supporting interoperability across engineering and environmental workflows.
  • Create, maintain, and update high-accuracy spatial datasets and geodatabases to support infrastructure design, environmental analysis, and land management projects.
  • Operate GPS/GNSS, Total Station, and UAV-based data collection systems and integrate field observations into GIS and CAD environments for validation and engineering deliverables.
  • Student Assistant – Department of Geography, University at Buffalo (Feb 2024 – May 2025)

    • Graded 400+ GIS lab assignments and developed 12+ curriculum-aligned assessments with 100% accuracy.
    • Condensed complex spatial concepts into keynotes, improving student comprehension and GIS engagement by 30%.

    GIS Intern – Municipal Corporation Kakinada (Jul 2024 – Aug 2024)

    • Mapped 22 reservoirs and traced 3 river intakes to optimize emergency water logistics across 38,000+ households.
    • Audited distribution records for 38,000 households, 2 reservoirs and 239 taps using MySQL, reducing data inconsistencies by 20%.
    • Upgraded 2 hydraulic networks through spatial modeling, enhancing flow analysis and monitoring reliability.

    Education

    State University of New York at Buffalo

    Master of Science in Geographic Information Science | CGPA: 3.64/4 | Aug 2023 – May 2025

    Andhra University

    Bachelor of Technology in Geo-Informatics | CGPA: 3.14/4 | Aug 2019 – May 2023

    Technical Skills

    My Academic Experiences and Professional Goals

    Academic Experiences

    1. Stormwater Risk Assessment for Kakinada City, India
      • Simulated drainage basins using ArcGIS hydrologic models and 2 field-surveyed DEM layers, improving runoff routing efficiency by 25%.
      • Detected 9 high-risk zones and proposed 6 critical pump locations, reducing seasonal flood vulnerability by 40%.
      • Outlined a drainage optimization strategy that mitigated flood recurrence across 1 urban sector.
      Stormwater Image 1 Stormwater Image 2
    2. Spatiotemporal Crime Intelligence – Chicago (2010–2023)
      • Developed 3 predictive models using 1.2M incident records and Random Forest algorithms, enhancing spatial forecasting by 31%.
      • Identified 17 high-incidence clusters, optimizing police resource allocation and reducing unit response time by 30%.
      • Analyzed 13-year crime trends to inform strategic realignment of 5 district patrol divisions.
      Crime Image 1 Crime Image 2
    3. Post-Wildfire Structural Damage Detection – Palisade 2025
      • Trained XGBoost model on 9,543 annotated structures with 6 multispectral and terrain-derived features, achieving 83.2% classification accuracy.
      • Combined ΔNDVI, ΔNBR, slope, land cover, wind speed, and footprint size to map structural loss with 92% spatial precision.
      • Published real-time predictions on a Folium web map, supporting 3 emergency teams in deployment across a 46-square-mile fire perimeter.
      Wildfire Image 1 Wildfire Image 2
    4. Urban Mobility Optimization via AI – Buffalo, NY
      • Analyzed Fruit-Belt zone for autonomous transit integration, emphasizing human-centered design and pedestrian safety.
      • Processed street-level imagery and user sentiment to assess environmental accessibility.
      • Recommended 19 infrastructure adjustments to optimize route safety and walkability for future autonomous operations.
      Mobility Image 1 Mobility Image 2
    5. Watershed Management Planning
      • Developed a comprehensive watershed management plan by integrating hydrological models and land use data.
      • Delineated watershed boundaries, identified pollution sources, and prioritized conservation areas through weighted overlay analysis.
      • Produced detailed maps for watershed delineation, pollution hotspots, conservation priorities, and sustainable land use recommendations.
    6. Geospatial Modeling of Vegetation Health in Arizona: A Co-Kriging Approach
      • Developed a co-kriging model in ArcGIS Pro to predict NDVI across Arizona, integrating elevation and temperature data for enhanced accuracy.
      • Conducted exploratory data analysis, semivariogram creation, and geostatistical modeling to assess spatial patterns and environmental influences.
      • Produced predictive NDVI maps and compared co-kriging with simple kriging to evaluate accuracy (RMSE: 0.117 vs. 0.118).
      Vegetation Image 1 Vegetation Image 2

    Professional Goals

    My professional goals are rooted in leveraging Geographic Information Systems (GIS), Remote Sensing, and Artificial Intelligence to address global challenges in urban planning, environmental sustainability, and disaster resilience. I aim to apply advanced geospatial analytics to improve decision-making in water resource management, climate change monitoring, and infrastructure development. I am particularly interested in integrating machine learning with GIS to build predictive models for risk assessment and smart city planning. I aspire to contribute to projects that involve spatial data infrastructure, autonomous mobility systems, and community-driven GIS platforms that promote equity and efficiency in urban services. My long-term goal is to lead innovative GIS initiatives that drive sustainable development and empower policy makers with actionable spatial intelligence.

    Research Project

    IDENTIFYING DAMAGED BUILDINGS IN THE PALLISADE WILDFIRE

    (Using Machine Learning Methods Integrated with GIS)

    Wildfires have become an increasingly severe threat to ecosystems and human infrastructure, particularly in California, where climate variability and expanding development in wildland-urban interfaces have intensified fire events, such as the Camp Fire (2018), Dixie Fire (2021), and Palisade Fire (2025). The 2025 Palisade Wildfire caused significant structural damage, highlighting the urgent need for rapid, accurate, and scalable damage assessment techniques. This study presents a machine learning (ML) and Geographic Information System (GIS)-integrated framework for building damage classification using high-resolution satellite imagery.

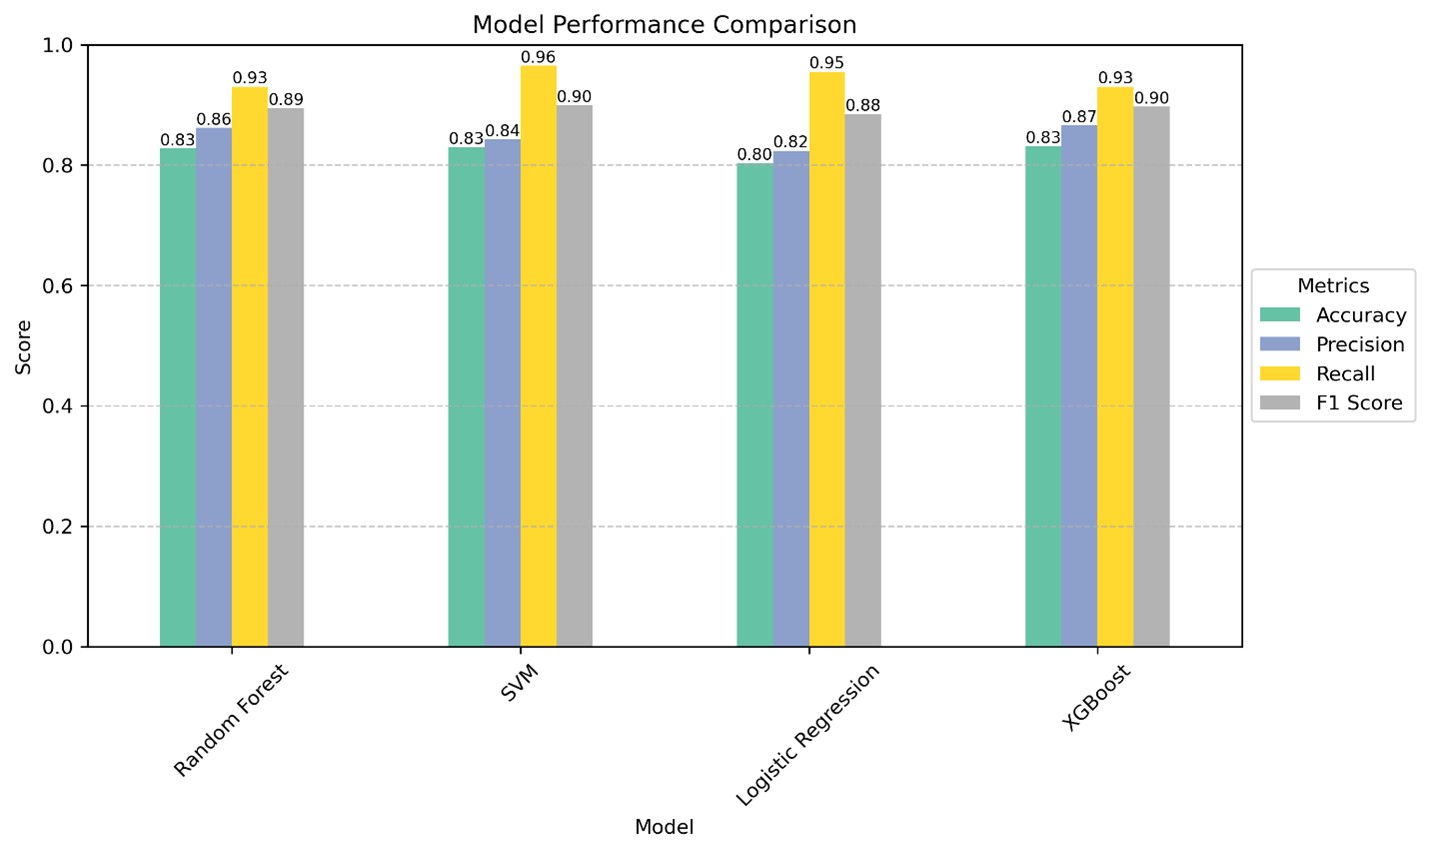
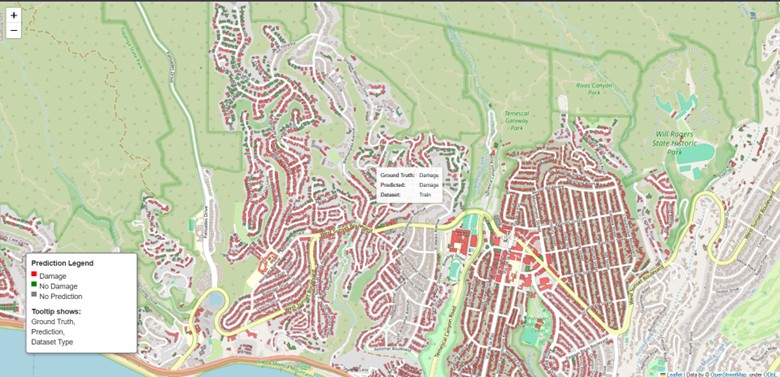
    Multitemporal 3-meter, 8-band imagery from Planet Explorer was used to derive key spectral indices—Normalized Difference Vegetation Index (NDVI) and Normalized Burn Ratio (NBR)—for pre- and post-fire conditions. From these, delta indices (ΔNDVI and ΔNBR) were calculated to measure vegetation loss and burn severity. Additional geospatial variables such as slope (DEM), land cover (NLCD), and wind speed (Global Wind Atlas) were integrated using ArcGIS Pro. Four ML models (RF, SVM, LR, XGBoost) were tested. XGBoost achieved the best accuracy of 83.2% with an F1-score of 0.90 (Damaged) and 0.53 (Undamaged). Results were visualized through an interactive Folium web map.

    For Complete Project Report Click Here

    📌 Project Highlights

    • 🛰️ Inputs: PlanetScope imagery, USGS DEM, NLCD, wind data
    • 📦 Dataset: 9,543 buildings labeled as Damaged/Undamaged
    • 🔁 Models: Random Forest, SVM, Logistic Regression, XGBoost
    • 📊 Metrics: Accuracy, Precision, Recall, F1-score, Confusion Matrix
    • 🗺️ Visualization: Folium web map with building footprint overlay
    • 📁 Deployment: Hosted via GitHub Pages

    🗺️ Live Interactive Map

    📂 Repository Access

    🔗 GitHub Repository

    • Palisade_wildfire_report: Project Documentation
    • pallisate_building_damage.zip: Code, output images, documentation
    • index.html: Exported Folium map
    • Palisade_point_data.csv: Spatial/spectral input data
    • README.md: Project overview

    🧠 Machine Learning Pipeline

    • Feature Extraction: ΔNDVI, ΔNBR, slope, wind speed, NLCD
    • Feature Engineering: Normalization, label encoding, class balancing
    • Model Training: RF, SVM, LR, XGBoost with stratified 80/20 split
    • Evaluation: Accuracy, F1-Score, Feature Importance
    • Deployment: Visualization using Folium + GitHub Pages

    🧩 Dependencies

    import pandas as pd
    import numpy as np
    from sklearn.model_selection import train_test_split, GridSearchCV
    from sklearn.preprocessing import LabelEncoder, StandardScaler
    from sklearn.ensemble import RandomForestClassifier, StackingClassifier
    from sklearn.svm import SVC
    from sklearn.linear_model import LogisticRegression
    from xgboost import XGBClassifier
    from sklearn.metrics import (classification_report, confusion_matrix, accuracy_score, precision_score, recall_score, f1_score)
    import geopandas as gpd
    import folium
    from folium import GeoJsonTooltip
    import matplotlib.pyplot as plt
    import seaborn as sns
                

    Application Study: AHP-Driven Groundwater Vulnerability Mapping

    Problem Statement

    Groundwater is vital to New York State's rural communities. However, challenges such as population growth, industrial activity, and climate change threaten its sustainability. Identifying potential groundwater zones is difficult due to heterogeneous subsurface conditions and multiple influencing factors. This project applies the Analytic Hierarchy Process (AHP) using Python and GIS to automate factor weighting and improve groundwater potential mapping.

    Objectives

    Complete Python Code

    # Install AHPY package first (if needed)
    # pip install ahpy
    
    from ahpy import Compare
    
    # Define pairwise comparisons for each factor relative to others
    lineament_density = {
        'lineament_density': 6,
        'geology': 5,
        'slope': 4,
        'soil': 3,
        'lulc': 2,
        'drainage_density': 1,
    }
    
    geology = {
        'lineament_density': 6/2,
        'geology': 5/2,
        'slope': 4/2,
        'soil': 3/2,
        'lulc': 2/2,
        'drainage_density': 1/2,
    }
    
    slope = {
        'lineament_density': 6/3,
        'geology': 5/3,
        'slope': 4/3,
        'soil': 3/3,
        'lulc': 2/3,
        'drainage_density': 1/3,
    }    
    
    soil = {
        'lineament_density': 6/4,
        'geology': 5/4,
        'slope': 4/4,
        'soil': 3/4,
        'lulc': 2/4,
        'drainage_density': 1/4,
    }
    
    lulc = {
        'lineament_density': 6/5,
        'geology': 5/5,
        'slope': 4/5,
        'soil': 3/5,
        'lulc': 2/5,
        'drainage_density': 1/5,
    }
    
    drainage_density = {
        'lineament_density': 6/6,
        'geology': 5/6,
        'slope': 4/6,
        'soil': 3/6,
        'lulc': 2/6,
        'drainage_density': 1/6,
    }
    
    # Calculate column sums for normalization
    column_totals = {
        'lineament_density': sum([1, 6/5, 6/4, 6/3, 6/2,6/1 ]),
        'geology': sum([5/6, 1, 5/4, 5/3, 5/2, 5/1]),
        'slope': sum([4/6, 4/5, 1, 4/3, 4/2, 4/1]),
        'soil': sum([3/6, 3/5, 3/4, 1, 3/2, 3/1]),
        'lulc': sum([2/6, 2/5, 2/4, 2/3, 1, 2/1]),
        'drainage_density': sum([1/6, 1/5, 1/4, 1/3, 1/2, 1/1]),
    }
    
    # Normalize weights for each factor
    lineament_density_weights = {key: value / column_totals[key] for key, value in lineament_density.items()}
    geology_weights = {key: value / column_totals[key] for key, value in geology.items()}
    slope_weights = {key: value / column_totals[key] for key, value in slope.items()}
    soil_weights = {key: value / column_totals[key] for key, value in soil.items()}
    lulc_weights = {key: value / column_totals[key] for key, value in lulc.items()}
    drainage_density_weights = {key: value / column_totals[key] for key, value in drainage_density.items()}
    
    # Output results
    print('Lineament Density Weights:', lineament_density_weights)
    print('Geology Weights:', geology_weights)
    print('Slope Weights:', slope_weights)
    print('Soil Weights:', soil_weights)
    print('LULC Weights:', lulc_weights)
    print('Drainage Density Weights:', drainage_density_weights)
            

    Interpretation & GIS Integration

    The resulting weights are imported into ArcGIS Pro's Raster Calculator to perform a weighted overlay. Each thematic layer (e.g., slope, land use) is multiplied by its respective AHP-derived weight to generate the final groundwater potential map.

    Output Insights

    Key Finding: High groundwater potential was identified in the central and northern regions of New York due to favorable geology and dense lineaments, while southern areas showed low potential due to urbanization and drainage patterns.

    Future Enhancements

    Visual Results

    Groundwater Potential Map 1 Groundwater Potential Map 2 Groundwater Potential Map 3

    Contact Me